
 Русский
 Español
 中文
中文Extended Metric List for Charts
We have optimized the performance of charts and fixed a major bug affecting their usability.
Last month we introduced charts to visualize report comparison functionality.
Based on your feedback, we have now expanded the list of metrics available for chart display.
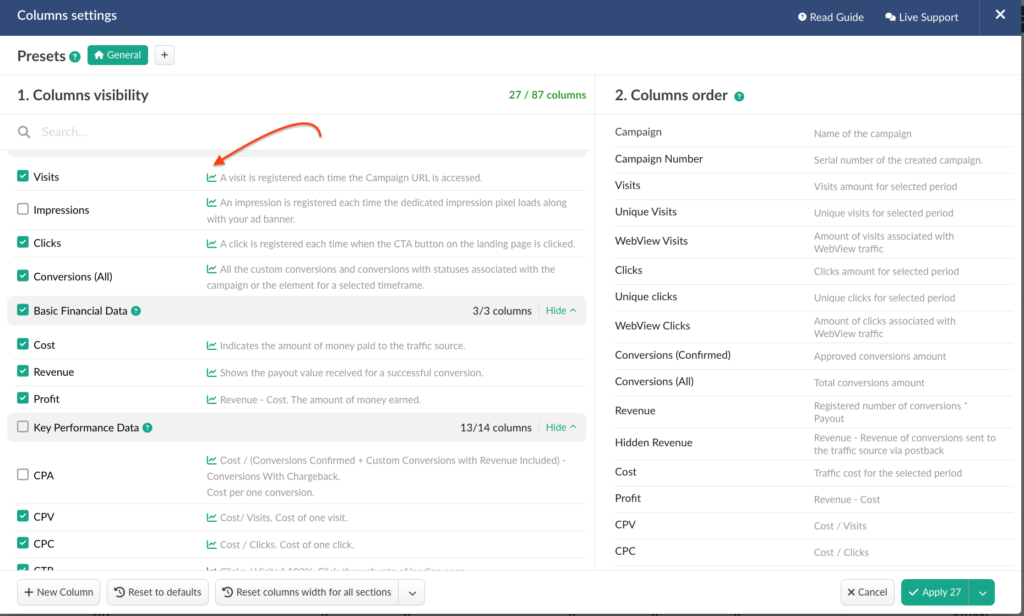
To add a metric to the chart, go to Column Settings and select the desired metric.
If the metric is available for charts, it will be marked with a chart icon in the settings.
Additionally we optimized the loading speed of reports with enabled charts, improved handling of workspaces, and added the option to select custom columns and conversions for chart display.
Report Comparison on Dashboard
Period Comparison on charts is now available across all report tabs: campaigns, offers, landers, flows, traffic sources, and affiliate networks.
We have also extended this functionality to the Dashboard page.
Search Bar Issue Fixed
Previously, clearing the search field did not fully remove the value, which kept reappearing when switching between tabs.
We had applied temporary fixes in the past, but now we are pleased to confirm that the issue is completely resolved: the search field clears properly when navigating across tabs.
📩 We highly appreciate your feedback and feature requests.
Feel free to reach us via Live chat from the panel or website and at support@bemob.com